Feature Selection in r using Ranking
Feature selection is an important step in machine learning. Often data sets contain features that are irrelevant or redundant to making predictions which can slow down learning down learning algorithms and negatively impact prediction accuracy.
“Some learning projects succeed and some fail. What makes the difference? The most important factor is the features used.” -Pedro Domingos
Depending on the context of the discussion features are also known as attributes or dimensions, or even fields. Features are the individual elements, values, in each instance (row) in the data.
What is Feature Selection?
Feature selection is one technique used to increase the predictive capability of a machine learning model; in other words, its goal is reduce errors when making predictions.
The breadth of this topic is enormous. Explanations are varied, assume certain reader backgrounds, and are often problem specific. Feature selection on brain scans looking for tumors, for example, is explained much differently than feature selection on data containing thousands of products and millions of people who have rated them to be used for recommendation predictions.
The depth of this topic ranges from the practical to the theoretical. How to implement in a given language/tool to degrees of freedom and cost functions.
To get a sense of this diversity in explanations try Feature Engineering in Machine Language or Feature Selection on Quora; and Feature Selection on Wikipedia or Andrew Ng’s Anomaly Detection | Choosing What Features To Use.
As a practitioner, learning the single most effective feature selection technique might seem like the wrong objective. That one effective technique you do find may only work well on one of your upcoming projects but not the next. Instead it might seem more reasonable to learn general guidelines or an approach to this important aspect of machine learning.
Similar topics are sometimes conflated. Feature extraction derives new features from the source features with the intention of enhancing generalization. Even though extraction sounds like plucking something out that already exists, here it means creating new and different features from the source features. Feature engineering is the use of expert domain knowledge to manually distinguish features such as the boundary around a tumor. These topics are not discussed here.
Generalization Reduces Overfitting
The expectation is that we train a particular machine learning algorithm on known data, analyze the error, and then use the trained algorithm on new data to predict the future. One caution is overfitting.
“Overfitting is an important topic. It is fair to say that the ability to deal with overfitting is what separates professionals from amateurs in machine learning” -Yaser Abu-Mostafa
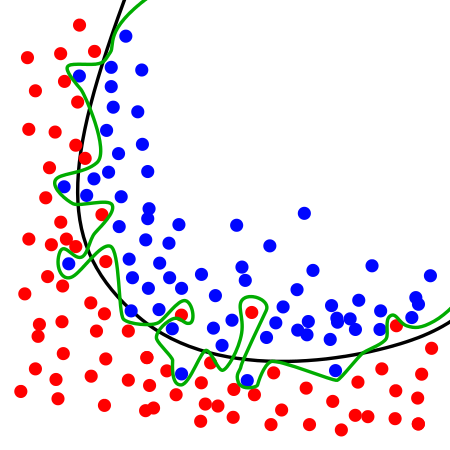
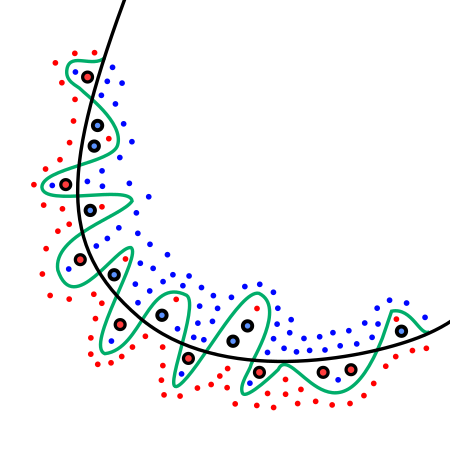
If we overly train a model (algorithm) using too many features, the model begins to “hallucinate” (Abu-Mostafa). It imagines a pattern in the data not really there. Simply because it is trying to account for every single point. An over-trained model like this is said to be overfitted and does not generalize well on new data. Regularization is the process of tuning the model so it does generalize to new data well.
How is Feature Selection Done?
Feature selection methods can regularize machine learning algorithms as well as speed up the process. In this tutorial we will be using the r environment with the FSelector package.
- Feature Ranking assigns individual importance values to individual features.
- Subset Selection builds combinations of features evaluating them as a group. There are three methodologies for subset selection. Filter methods evaluate a subset’s statistical performance without considering any specific classifier. Wrapper methods use some predictive algorithm to evaluate subsets of features. Embedded methods provide selection as part of the model construction of a classification algorithm.
Project Setup
Similar to the Introduction to Weka we use the existing products lists to determine which features are most important in predicting Sales Volume. Assuming the r environment is installed on your machine, lets start with a simple example. Begin by downloading the project data. And running this code in r.
library(FSelector)     # provides chi.squared and others
library(ggplot2)       # plotting
library(gridExtra)     # plot adjust
library(grid)          # plot adjust
setwd("/Users/xyz/rData")
oldProducts <- read.csv('existing-product-attributes.csv'
                       # read data
                       , sep=","
                       , header = T
                       , as.is=T
                       , stringsAsFactors=F
                       , check.names = FALSE)
weights <- chi.squared(Volume~.,oldProducts)     # weight each feature
                                                 # using chi-squared test
ranking <- data.frame(features=rownames(weights) # row names to column
                      ,importance=weights$attr_importance)
                      # rename attr_importance to importance

p1 <- ggplot(data=ranking[which(ranking$importance > 0.5),],
                                     # plot only values > 0.5
            aes(x=reorder(features   # reorder features
                  , importance)
                  , y=importance     # fill with importance value
                  , fill=importance)) +
           cord_flip() +             # flip axis
           geom_bar(stat="identity"  # height relative to value
                  , width=0.25) +
           geom_col(position="dodge") +
           scale_fill_gradient(low="green"
                  , high="green4"    # grad emphasizes importance
                  , space="Lab"
                  , guide = FALSE) +
           labs(x=NULL, y=NULL)+
           theme(axis.text.x=element_text(angle=0
                  , hjust=1
                  , size=12)
                  , axis.text.y=element_text(size=12))
grid.arrange(textGrob("Feature Ranking using Chi-squared",
             gp = gpar(fontsize = 2*11, fontface = "bold")),
             p1,                     # center title
             heights = c(0.1, 1))
Feature Ranking in r
Ranking places a value on each individual feature. They can then be sorted in order of importance. The least important can be easily identified and removed. There are multiple methods Weka provides. Below we see Chi-Sqaured, Relief, and Random Forest.
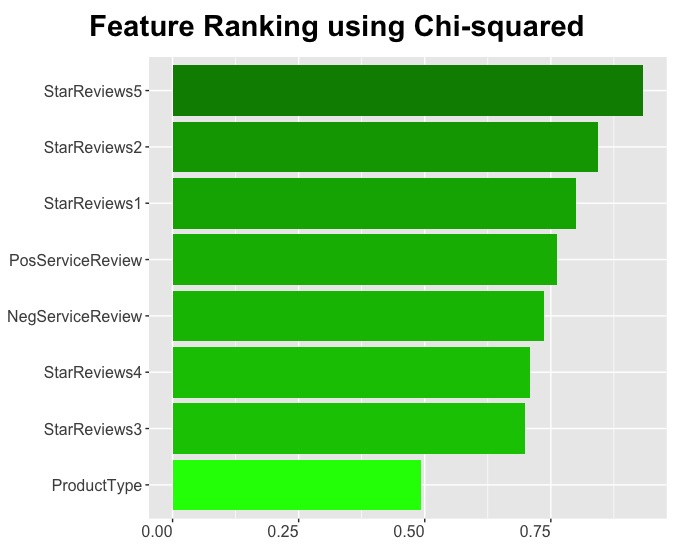
Chi-Squared
The Chi-squared algorithm evaluates the the importance of each individual feature in the context of the classifier (sales volume). This algorithm does several things. First, it discretizes the continuous feature being evaluated. Then determines the weight of dependence of the class on the feature. It then confirms the discretized data accurately represents the original value.
In this r plot zero-valued features are removed. Features are ordered and gradient filled to emphasize importance visually.
Change the r code to get results for relief and random forest.
weights <- relief(Volume~.,oldProducts)        # weight using relief

weights <- random.forest.importance(Volume~.   # using random forest
                         , oldProducts         # 1 = mean decrease
                         , importance.type=1)  # in accuracy
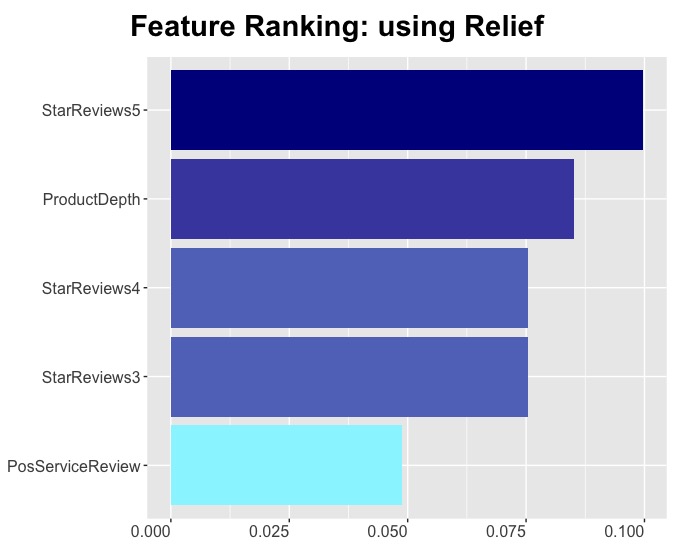
Relief
Relief scoring determines a feature’s value from how well its value is distinguished between instances that are near to it. For example, if a feature is observed close to a neighbor having the same class, it is considered a ‘hit’ and the feature score decreases. However, if the feature is observed with a neighbor having a different class it is considered a ‘miss’, and the feature score increases.
In this r plot features with importance values < 0.025 are removed. Features are ordered and gradient filled to emphasize importance visually.
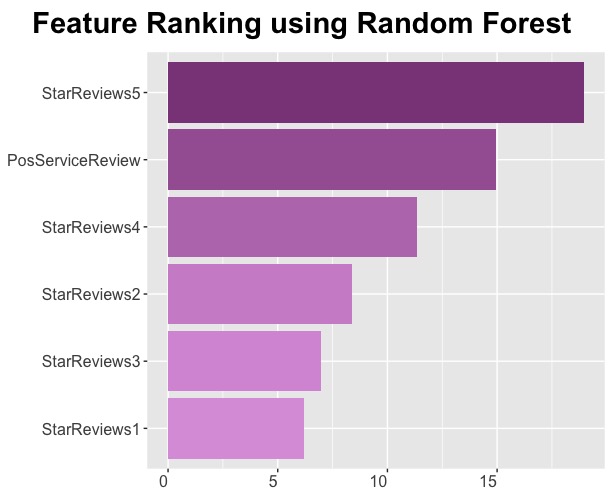
Random Forest
FSelector contains the random.forest.importance function which rates rates the importance of individual features used in the classification (sales volume) of the outcome. Like the others above it returns a data frame containing names of each feature and a value for importance based on the mean decrease in accuracy.
Resources
Abu-Mostafa. Overfitting. Lecture 11. Retrieved March 2, 2017.
Tang, Alelyani, and Liu. Feature Selection for Classification: A Review. Semantics Scholar.
Kumar, Minz. Feature Selection for Classification: A Review. Smart Computing Review. 2014.
Sharma, Amarnath, Kankar. Use of Feature Ranking Techniques for Defect Severity Estimation of Rolling Element Bearings. International Journal of Acoustics and Vibrations. 2018.
Yu, Liu. Efficient Feature Selection Via Analysis of Relevance and Redundancy. Journal of Machine Learning Research. 2004.
Wikipedia. Exploratory Data Analysis. Retrieved July 21, 2018.
Domingos. A few Useful Things to Know about Machine Learning.Department of Computer Science and Engineering University of Washington. 2012.